1. Lab
11: Work-Kinetic Energy Theorem Activity
a. Lab
conducted by Mohammed Karim (author), Lynel, Andrew, and Richard.
2. Objective
– This lab contained two parts. The
first part dealt with finding the work done by a nonconstant spring force.
Basically, we were to find the work done by stretching a spring with a cart.
The second part dealt with the work kinetic energy principle. Our goal was to
relate force and position and kinetic energy and position.
3. Theory/Introduction
– We know the work is force * distance or the area under the curve of a force *
distance graph. If we were to calculate the force over position of a cart
opposing a spring and integrate it, we could find the work done. Next, we can
take another similar scenario and relate position and kinetic energy as the
work done by the spring force can be related to kinetic energy as explained by
the work kinetic energy theorem.
4. Apparatus/Procedure
– Explain Apparatus and Procedure
The
apparatus above features a cart on a track attached to a spring. We used a
force probe to measure the force applied. We measured the position and moved
the cart 0.6 meters and plotted our values on a force over position. After
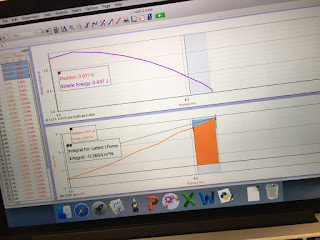
plotting it, we found the slope of the tangent line and measured the area under
the curve. (See figures 11.1 and 11.2). The slope of the tangent line would be
our spring constant. (8.828 N/m). The area under the curve of the graph would
be the work done.
As for the second experiment, we placed a 0.7+/-
0.01kg cart on a track with a stretched spring attached to it. We then measured
the compression of the spring as it goes back to a state of equilibrium. We
took the values of Force, position, and kinetic energy and graphed them to see
the relationship (See Figure 11.3)
5. Data
Tables
Figure 11.1 – Picture of the slope of the
tangent line. The m value, or the slope, is the spring constant used in
equations involving a spring and work/force.
Figure 11.2 – Picture of the area under
the curve. The area represents the work done.
Figure 11.3 – Graph of Force over
position and Kinetic Energy over position
Any
data tables/pictures referred to during experiment.
6. Conclusion
– The graphs from this activity/lab relate many important concepts. From a “graph”
standpoint, it helped me understand the relation and derivation for certain
values and equations. Aside from work is the integral of force with respect to
time, I found out some new information, such as the value k, the spring
constant, is found through the slope of the tangent line of the force vs.
position graph. I now see the relationship between force and kinetic energy, as
shown by the graphs. This relates the work kinetic energy theorem. As force vs
position increases, kinetic energy decreases.


No comments:
Post a Comment